Trade Volume Bubbles on the Heatmap
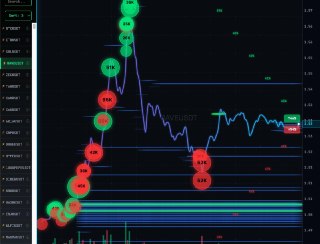
A new visualization layer has been added to the heatmap screener: real-time trade volume bubbles.
Buy and sell market orders now appear as color-coded circles directly on the price chart, with size proportional to trade volume. The feature is controlled via the Bubbles slider, allowing traders to filter by minimum volume threshold.
This addition transforms the heatmap from a limit-order-only view into a comprehensive order flow visualization tool, showing both passive (limit) and aggressive (market) order activity in a single interface. The next development milestone is implementing historical heatmap replay — enabling traders to review past market microstructure events.