Market Table: Real-Time Inter-Token Dynamics Visualization
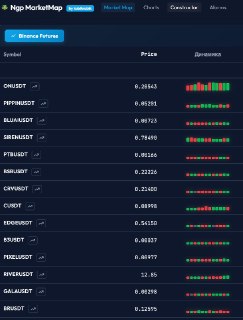
A new dynamics visualization feature has been added to the Market Table screener (map.p3p3.tech).
The update introduces real-time micro-candle generation for each token, enabling traders to instantly identify where volatility is spiking and directional movement is occurring at any given second. The visualization makes it possible to spot momentum shifts across hundreds of tokens simultaneously — a capability that would require dozens of individual chart windows in a traditional terminal setup.
To use the feature, open the Market Table page and allow 1-2 minutes for the real-time candle data to accumulate. The charts update continuously as new market data arrives.