Heatmap Probability Indicator: Real-Time Price Direction Forecasting
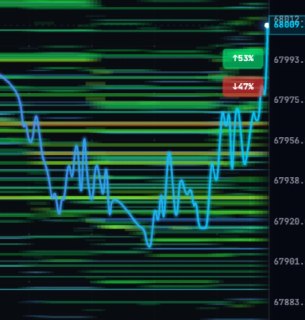
A new analytical feature has been integrated into the heatmap screener: a real-time probability indicator that estimates the likely direction of price movement in the coming seconds.
The system continuously evaluates order book imbalances — comparing the volume and density of limit buy orders (bids) versus sell orders (asks) within the nearest percentage range of the current price. This produces a dynamic signal indicating whether buying or selling pressure currently dominates.
The indicator is rendered as a smooth, pulse-like curve rather than the previous angular line chart. The redesigned visualization makes directional bias easier to read at a glance during fast-moving market conditions.